Example 7: Server statistics

Visualization
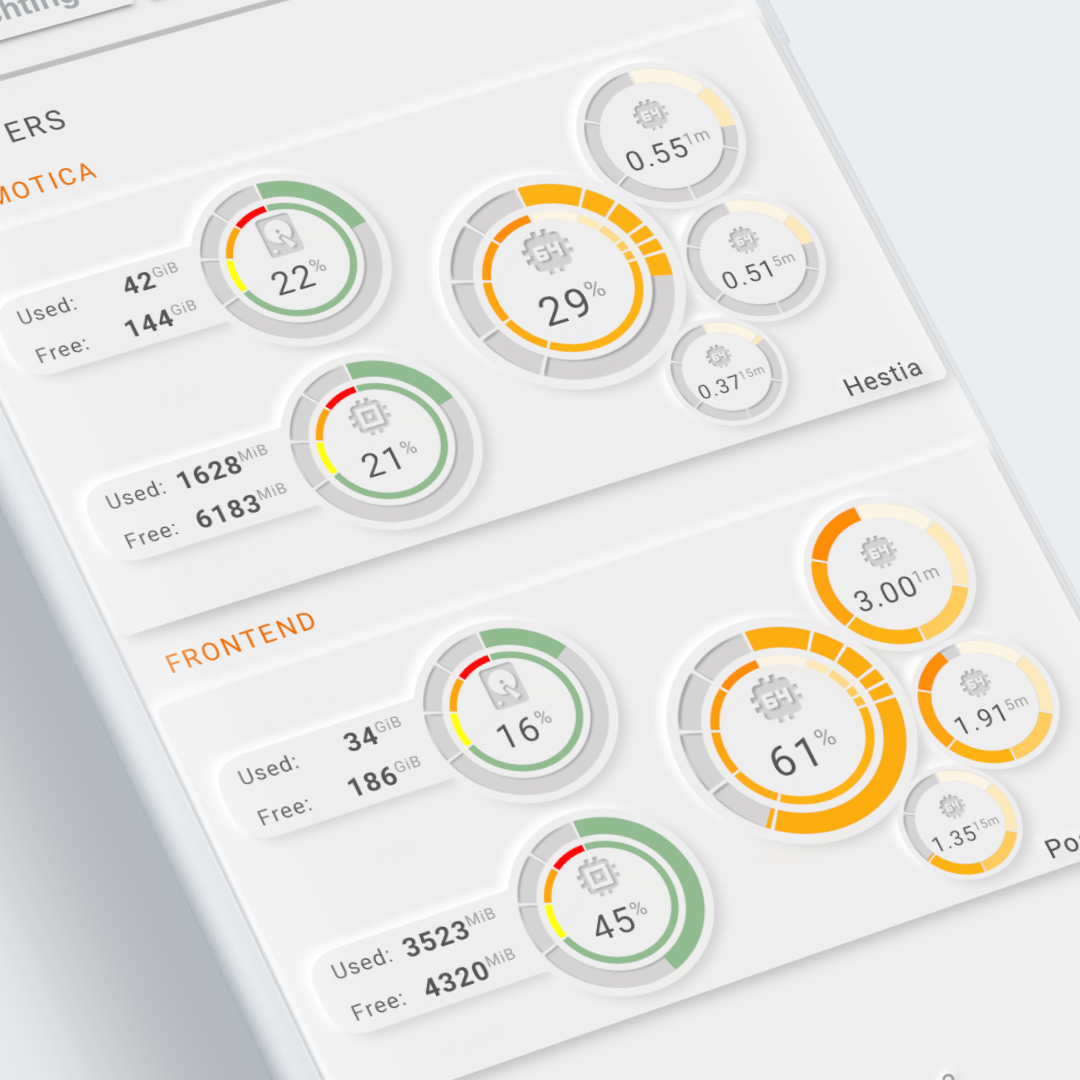
Visualization of the basic data of two servers. My basic NUC (J3455 CPU) running Home Assistant and another bunch of containers and a second server as a frontend for the ugly internet. This one is also running a bunch of docker containers.
Both systems were 'loaded' before the screenshot was taken to show the different colorstops
The default load of the NUC is around 3% and the frontend around 11%.
Interactions
- All tools support by default the "more-info" dialog once clicked.
Used Home Assistant Integrations
- The System Monitor integration
- The Glances integration
- The RESTful sensor integration to get extra sensors from Glances, as the default Glances integration does not give you all the 'load' sensors.
Below the sensor: configuration for the System Monitor and extra Glances RESTful sensors:
| System Monitor sensors | |
|---|---|
1 2 3 4 5 6 7 8 9 10 11 12 13 14 15 16 17 18 19 | |
| Extra Glances sensors | |
|---|---|
1 2 3 4 5 6 7 8 9 10 11 12 13 14 15 16 17 18 19 20 21 22 23 24 25 26 27 28 29 30 31 | |
The top card uses the system monitor integration, the bottom card the Glances and RESTful sensor integration
How to make it work in your own installation
The Hestia server card
Required Home Assistant Integrations
The visualization is build on the system monitor, so you need the The System Monitor integration
Required Home Assistant Entity Changes
The System Monitor entities should be the same for any installation, so no changes required on that part.
The Poseidon server card
Required Home Assistant Integrations
- The Glances integration
- The RESTful sensor integration to get extra sensors from Glances, as the default Glances integration does not give you all the 'load' sensors.
Required Home Assistant Entity Changes
The Glances integration creates environment dependent entities: the server name is usually added to the integration, and thus entity id's. My integration is called Glances-Poseidon and thus the entities for instance sensor.glances_poseidon_cpu_load. You have to change the entities to your own entity id's.
If you have only 1 server, remove the second server...
View and Card Configuration
- The upper-left shows the DISC usage values as text in a rectangle and in a
segmented arcfor the percentage. The scale is green upto 70% and then changes to yellow, orange (80%) and red (90%). - In the lower-left, the same for RAM usage.
- The central part shows the CPU usage
- And finally the three system load toolsets (1m, 5m and 15m) nicely wrapped alongside the CPU display.
Lovelace view
| file | location | included from |
|---|---|---|
view-sake7.yml | /lovelace/views | sak-examples-dashboard.yaml |
Decluttering templates
None.
SAK templates
Re-use of toolsets and toolset scaling
| From: view-sake7 | |
|---|---|
1 2 3 4 5 6 7 8 9 10 11 12 13 | |
Remarks
This view is a nice example of the use of toolset scaling!